Food and energy are equally dependent on each other. The connection between the systems is known as the Water-Energy-Food Nexus and to find this equation you need to know the volume of Virtual Water. What Is Virtual Water?
Virtual Water is the unknown hidden amount accounting for 90% of H2O that is used by developed countries making up the Total Water Footprint that consists of the production of goods, electricity, manufactured products, & food that is the direct & indirect summation of all the water that’s consumed.
The Water Footprint looks at both direct and indirect water use of a process, product, company, or sector and includes water consumption and pollution throughout the full production cycle from the supply chain to the end user. That’s You.
What is Virtual Water
With growing concerns over Water Scarcity throughout the world, new concepts are being developed to offset the impending danger that is ever-present and approaching in the near future. One such idea is the virtual water concept. This is regarded as one of the water-saving methodologies in product production.
The amount of direct and indirect freshwater used to produce the product in the area where the product is produced primarily because of increasing virtual water use, as more people consume more water-intensive food, electricity, and consumer goods, putting more and more pressure on water resources is an important part of what products should be grown or imported to certain countries.
If you know the amount of this virtual water requirement for a particular product, a country can avoid producing it in the water-scarce region and can import it from other water-rich regions. Which in the end benefits both countries. This pertains to all parts of the world where agriculture is important and water is in danger of drying up in the future.
In the near future, researchers believe that water is to be depleted for numerous reasons like climate changes or prolonged drought conditions in the States and other countries. By developing these Water Footprints they can help individuals, businesses, and countries by revealing water use patterns from small individual levels to large National levels.
They can show how much water is used in all facets of producing goods. This creates a reference that will break down the use of water and make the use of water more efficient in the future.
Reducing Water Consumption
Food, water, and energy systems are closely connected to each other because water is crucial to making each one work. It takes water to grow crops and produce energy. It also takes lots of energy to treat and move water. Food and energy are equally dependent on each other. The connection between the systems is known as the Water-Energy-Food Nexus.
In places like California Agriculture accounts for 80% of water use by humans. One of the main problems with the use of this water is the water that’s used comes back into the system polluted with pathogens from livestock, pesticides, nitrates in groundwater, trace metallic elements, and emerging pollutants, including antibiotics and antibiotic-resistant genes excreted by livestock.
A Water Foot Print is a more specific measurable amount of water that is consumed, evaporated, and polluted:
Blue Water Footprint: The amount of surface water and groundwater required (evaporated or used directly) to produce an item. Green Water Footprint: The amount of rainwater required (evaporated or used directly) to make an item.
Grey Water Footprint: The amount of freshwater required to dilute the wastewater generated in manufacturing, in order to maintain water quality, as determined by state and local standards. ![]() You can get an idea of how much each type of water is used for various products that are normally manufactured in a Water Footprint Gallery
You can get an idea of how much each type of water is used for various products that are normally manufactured in a Water Footprint Gallery
Part of what’s called a Water Footprint Network was created and developed by Dr. Arjen Hoekstra who, along with the others at the (WFN) developed the framework and established the international organization as the foremost research network in the discipline.
The network brings together groups of professionals who are concerned about growing water scarcity and increasing water pollution levels. Water Footprint Network distinguishes two types of partnership: Professionals and Partners.
Its mission statement says that they use the Water Footprint concept to promote the transition toward fair, sustainable, and efficient use of freshwater resources worldwide. Partners-Our valued partners represent leaders from all sectors producers, investors, suppliers, and regulators as well as non-governmental organizations and academia who can help us advance more quickly by sharing learning and keeping up to date with the latest information.
You can join the Network yourself and recognize the worldwide importance of this important research in action. Professionals are individuals who are active in research, consulting, policy, or in any other capacity related to water footprint action.
Virtual Water Examples
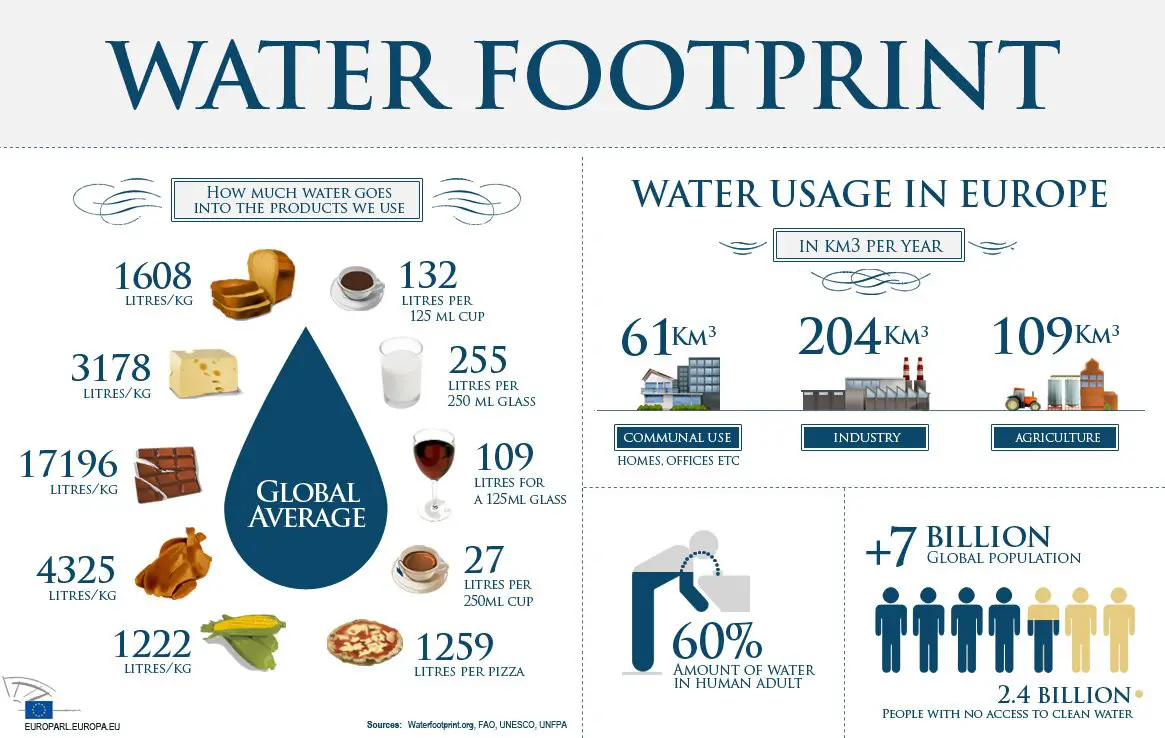
Water that is not felt or seen (Virtual Water) is required for most of the steps used in manufacturing Goods for the consumer used every day for millions of products. The water footprint is calculated by adding up all of the water required for each step of the production process. Table 1 lists a sampling of water footprints for the manufacturing of some common consumer goods. Some Common products like:
- Car is 13,737 – 21,926 gallons
- Leather Shoes-3,626 gallons
- Smart Phone -3,190 gallons
- Bed Sheet -2,839 gallons
- Cotton Jeans -2,108 gallons
- Cotton T-Shirt-659 gallons
Broken down as an example a Cell Phone uses many different manufacturing processes and uses numerous different resources, materials, and parts to go into smartphone manufacturing. This includes rare earth metals (e.g., lithium), tin, glass, and plastics.
The supply chains for these materials stretch around the world to places like Indonesia, the Philippines, and China. Production might include steps like mining precious metals, creating synthetic chemicals for glue and plastic, and assembling and packaging.
Collectively, the water associated with each step adds up to the blue water footprint. The Energy to make the Cell Phone and get that Cell Phone to you is enormous. What most people don’t understand is the Virtual Water that is unseen that’s used in the Wastewater from a product that is made in China, shipped to the US, and trucked to Stores across the States is taken from the local waterways of the consumer.
This Grey Water is used constantly for use in diluting mixing and treating the by-products and waste that are leftover from what was the Cell Phone. This volume of Grey Water is calculated within the volume of the Cell Phone’s Water Footprint.
Water Footprint of Food
In the entire nation, it’s Agriculture that accounts for 38% of Freshwater withdrawal but it accounts for approximately 80 to 90% of the Nations consumption. Here are some examples of some foods and what Water’s Virtual uses to get that food to your plate.
- 6 oz. Beef Steak is 674 gallons
- 1 Hamburger includes bread, lettuce, and tomato -660 gals.
- 3 oz Pork -135 gallons
- 1 Egg -52 gals.
- 1 Cup of Coffee and 1 Glass of Wine- 34 gals.
Because food has 3 components to its Foodprint that are calculated into it the reason that the usage is so high. Meats and Animal products demand the most usage like dairy and eggs because animal feed typically comes from either irrigated or rain-fed grains or rain-fed forage (like grass), both of which have large blue and green water footprints.
Their food comes from the animal feed that is grown from the irrigated fields of grains or watered grasses which of them include a large Blue or Green Water Footprint. Farm animals feed on Soy and corn that rely on rain or irrigated farmland. Irrigation comes from surface or groundwater sources that are also claimed by other users like Energy Companies or urban areas or are required by law to keep aquatic habitats healthy.
Animals that are raised in pasters eat forage that relies on rainwater to grow so they require more Green Water Footprint and less Blue Water Footprint. They also have a less Grey Water Footprint because less requirement is needed for wastewater than a feedlot operation type farm. Sustainable Farming techniques that are new such as hydroponic, aquaponic, aeroponic, and vertical farming now make it possible to grow to produce very efficiently, minimizing water use in a variety of locations including smaller spaces and controlled environments that can reduce water and energy costs.
Water Footprint Calculator
- Find the Foods that you want to find the Water Footprint of. This step is easy: All you have to do is think of a food that you want to find the water footprint of. As an example, I’m going to be finding the water footprint of one slice of bread.
- Visit WaterFootprint.org (specific link is below) Go to the waterfootprint.org website Water Footprint Gallery and you’ll find an interactive gallery that shows the water footprint of different foods and products in liters per kilogram.
- Find the Water Footprint of Your Food (L/kg) Find your food in the interactive gallery. If you’re lucky, there might already be a water footprint per item. In this case, you’re done and you can skip the rest of the steps. Otherwise, look to the bottom right of the gallery and you’ll find the water footprint in liters per kilogram.
- Find the mass (or weight) of your Food in kilograms. To find the mass of your food, you could weigh it with a scale. If you don’t have a scale or if you don’t have the food in front of you, you could also search online for the average weight of your food. For example, when I search for the average weight of a slice of bread on Google, I find that it’s around 50 grams.
- Calculate the Actual Water Footprint Last step! All that’s left now is to calculate the water footprint of your food. Here’s how: Multiply the water footprint (L/kg) that you found in Step 3 by the mass of your food (kg) that you found in Step 4. For example, the water footprint of bread in L/kg is 1608L/kg, and the mass of one slice of bread in kg is about 0.05kg. 1608 × 0.05 = 80.4 Therefore, the water footprint of one slice of bread is 80.4 liters
What Countries Import Water
Water is not evenly divided into the earth parts of North America get more than their share while places in the Middle East can barely survive or farm on what they have.
With Virtual Water and Trade a country that is suffering from Water Scarcity can strategically trade its way out of a water deficit using other countries that don’t have the same problems. If water-intensive crops, such as wheat or rice, are produced in water-abundant regions and then imported, instead of grown with scarce local water it would be possible to feed more of their people with less stress.
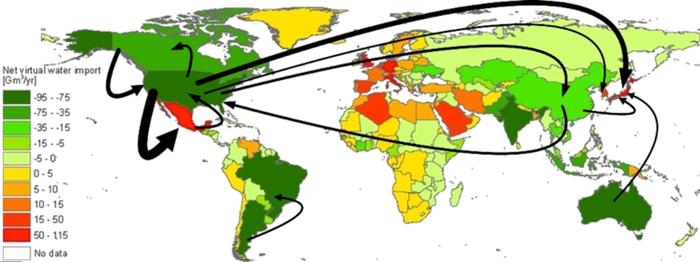
World food trade or at least the idea has been around for a while, however, it’s problematic because countries that trade are subject to tariffs and restrictions and are not fully liberalized to allow free virtual water trade. The figure below illustrates the global virtual water trade.
The countries highlighted in green are ‘net exporters of virtual water as they provide the global economy, and the countries highlighted in yellow and red are ‘virtual water net importers with water embedded in food commodities imports.
About 160 out of 210 national economies worldwide are ‘net virtual water importers. The major ‘net exporting’ economies, such as countries in North America, Latin America, Australia, and Asia, is located in well-endowed hydrological regions, with the additional advantage of sound infrastructure to enable trade with other economies.
The black arrows illustrate the trade flows of virtual water between countries, See the importance of the US in commodity trade. Green Water is root zone water in the soil profile while Blue Water is irrigation water diverted from the surface or pumped from the groundwater.
If the origin of the water is Green Water, then the amount of Virtual Water in a commodity is significantly lower than when blue water via an irrigation system is the source. Water content is much lower in regions where the water use efficiency of crops is high.
The Water Footprint Network alliance draws together researchers and expands knowledge on the drivers and consequences of water scarcity and pollution to transform the way we use and share freshwater within the earth’s limits. It identifies knowledge gaps, coordinates, promotes areas of research, and supports knowledge sharing. Worldwide sustainable successful water use can be realized with the help of a world community working together and sharing our # 1 Commodity Water!
![]()
References:
Virtual Water and Water Footprint–Virtual water and trade